How to Debug JavaScript Like a Professional
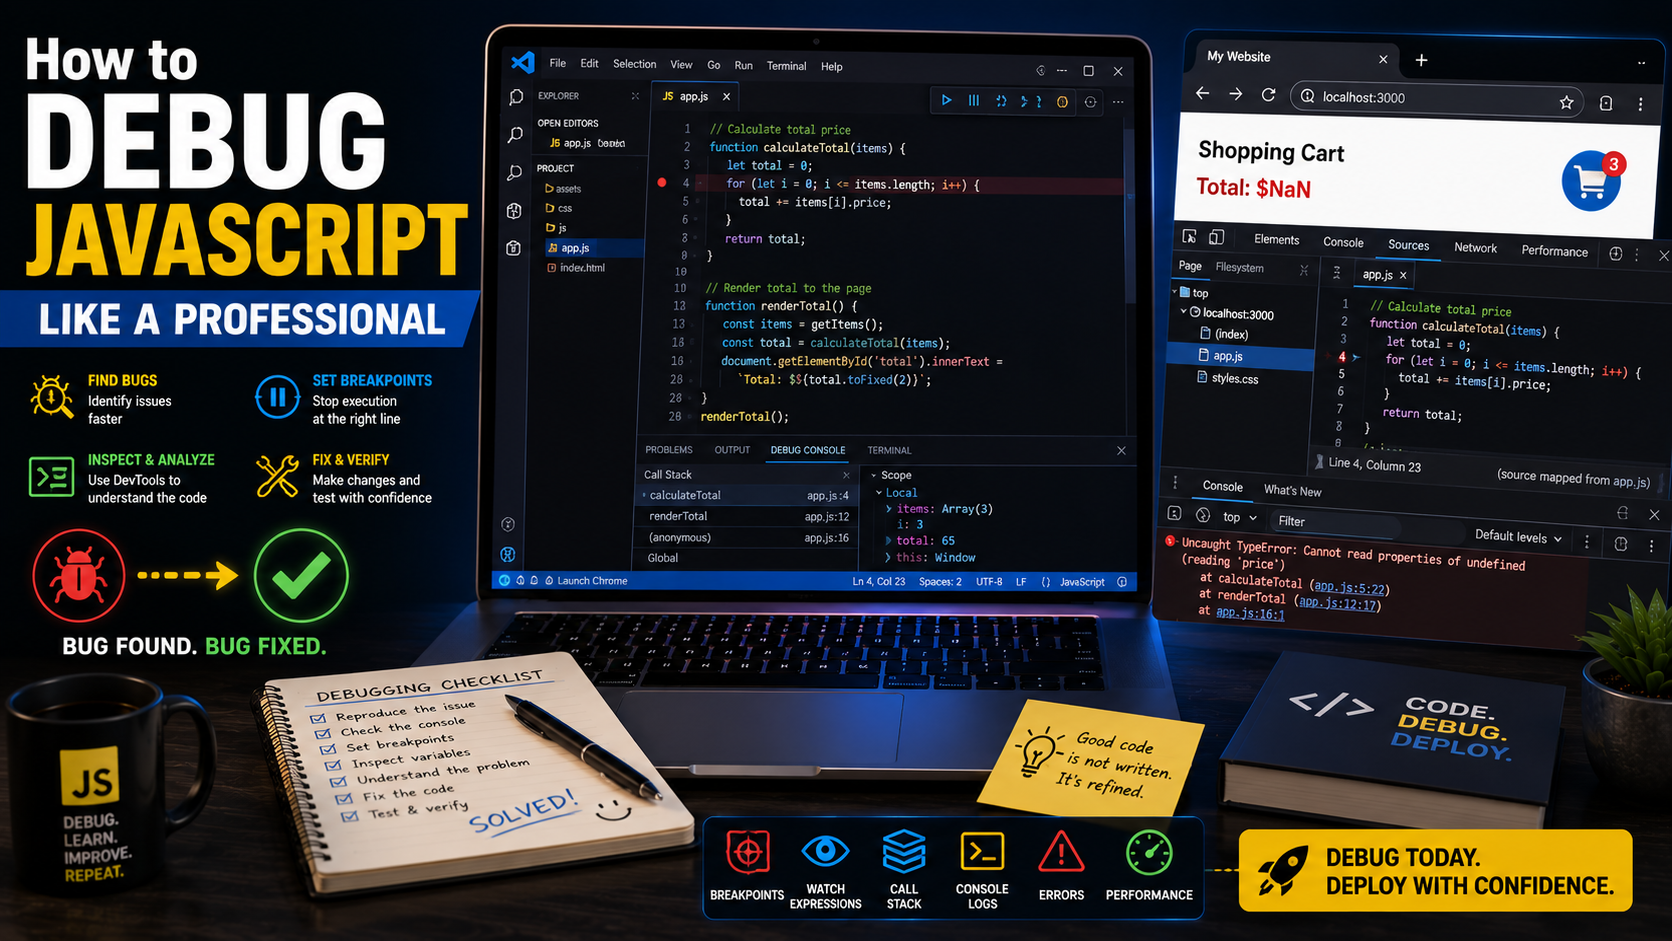
How to Debug JavaScript Like a Professional
Every JavaScript developer writes code that contains bugs. Even experienced programmers encounter unexpected errors, broken features, and confusing behaviors. The difference between beginners and professionals is not the number of mistakes they make—it's how efficiently they find and fix them.
Debugging is one of the most valuable skills in web development. Once you learn the right techniques and tools, solving problems becomes much faster and less frustrating.
In this guide, you'll learn how to debug JavaScript like a professional using modern browser tools and proven best practices.
What Is Debugging?
Debugging is the process of finding, identifying, and fixing errors (also called bugs) in your code.
Common JavaScript bugs include:
Syntax errors
Reference errors
Logic errors
Type errors
Runtime errors
Finding the exact cause of a bug is often more important than rushing to fix it.
Common JavaScript Errors
1. Syntax Errors
These occur when JavaScript code is written incorrectly.
Incorrect:
function welcome(){
console.log("Hello")
}
Correct:
function welcome(){
console.log("Hello");
}
The browser will usually indicate the line where the syntax error occurred.
2. Reference Errors
A reference error happens when you use a variable that hasn't been declared.
Example:
console.log(userName);
Output:
ReferenceError: userName is not defined
Always declare variables before using them.
3. Type Errors
These occur when you perform an invalid operation on a value.
Example:
let age = null;
console.log(age.toUpperCase());
Output: TypeError: Cannot read properties of null
Check that values exist before calling methods on them.
4. Logic Errors
Logic errors don't stop your program from running, but they produce incorrect results.
Example:
let total = 10 + 5 * 2;
If you intended (10 + 5) * 2, use parentheses to make the calculation explicit.
Using console.log()
The simplest debugging tool is console.log().
Example:
let username = "Christian";
console.log(username);
Output:
Christian
You can also inspect objects:
const user = {
name: "Mary",
age: 22
};
console.log(user);
Printing values helps verify that your variables contain the expected data.
Understanding the Browser Console
Every modern browser includes a Developer Console.
To open it:
Google Chrome: Press F12 or Ctrl + Shift + I
Mozilla Firefox: Press F12
Microsoft Edge: Press F12
The Console displays:
Errors
Warnings
Log messages
Stack traces
Review the first error carefully—it often points directly to the underlying problem.
Using Breakpoints
Breakpoints pause JavaScript execution so you can inspect the program's current state.
Steps:
Open Developer Tools.
Select the Sources tab.
Open your JavaScript file.
Click a line number to set a breakpoint.
Refresh the page or trigger the code.
When execution pauses, you can inspect variables and step through the code one line at a time.
The debugger Statement
JavaScript also provides a built-in debugger keyword.
Example:
let total = 50;
debugger;
total += 25;
If Developer Tools are open, execution pauses at the debugger statement automatically.
Inspecting Variables
While paused at a breakpoint, you can examine:
Variable values, Function parameters, Objects, Arrays
This helps identify incorrect data before it causes additional errors.
Reading Error Messages
Never ignore browser error messages.
Example:
Uncaught TypeError:
Cannot read properties of undefined
This tells you:
The type of error, The affected object, The approximate location of the problem.
Learning to interpret these messages is a key debugging skill.
Debugging DOM Problems
Suppose your HTML contains:
<p id="message">Welcome</p>
JavaScript:
document.getElementById("message").textContent = "Hello!";
If the ID is misspelled:
document.getElementById("messages").textContent = "Hello!";
The browser returns:
Cannot read properties of null
Verify that IDs, class names, and selectors exactly match your HTML.
Checking Network Requests
Many websites load data from APIs.
Use the Network tab in Developer Tools to inspect:
Failed requests
Response codes
Loading times
Downloaded resources
Status codes to know:
200 – Success
404 – Resource not found
500 – Server error
These codes help determine whether the problem is in your JavaScript or on the server.
Debugging Asynchronous Code
When working with fetch() or Promises, errors should be handled properly.
Example:
fetch("data.json")
.then(response => response.json())
.then(data => console.log(data))
.catch(error => console.error(error));
Using .catch() makes debugging asynchronous code much easier.
Common Debugging Mistakes
Avoid these habits:
Guessing instead of investigating.
Ignoring browser error messages.
Leaving console.log() statements in production code.
Testing only in one browser.
Changing multiple parts of the code at once.
Fix one issue at a time so you can clearly identify what solved the problem.
Best Practices
Professional developers typically:
Read the full error message.
Reproduce the bug consistently.
Use breakpoints instead of excessive logging.
Test fixes thoroughly.
Write clean, well-organized code.
Use version control to track changes.
Remove temporary debugging code before deployment.
Helpful Debugging Tools
These tools can significantly improve your debugging workflow:
Visual Studio Code
Chrome Developer Tools
Firefox Developer Tools
Microsoft Edge Developer Tools
ESLint
Prettier
Git and GitHub
Each tool helps identify different types of issues, from syntax errors to formatting inconsistencies.
Practical Mini Project
Create a simple To-Do List application and intentionally introduce a few mistakes, such as:
A misspelled variable name.
An incorrect HTML element ID.
A missing closing bracket.
An invalid array index.
Use the browser console, breakpoints, and the debugger statement to locate and fix each issue. This hands-on exercise will strengthen your debugging skills.
Frequently Asked Questions
Is debugging a difficult skill?
No. Like programming itself, debugging becomes easier with regular practice and familiarity with the available tools.
Should I use console.log() or breakpoints?
Both are useful. console.log() is quick for simple checks, while breakpoints provide a deeper view of your program's execution.
Why does JavaScript stop working after one error?
Some errors, particularly syntax errors, can prevent the browser from executing the remaining code. Reading the first reported error is usually the best starting point.
Conclusion
Debugging is an essential part of becoming a successful JavaScript developer. Every bug you solve improves your understanding of the language and strengthens your problem-solving abilities.
By learning to interpret error messages, use browser Developer Tools, inspect variables, work with breakpoints, and debug asynchronous code, you'll resolve issues more efficiently and write more reliable applications.
Remember, great developers aren't those who never make mistakes—they're the ones who know how to find and fix them quickly.
For more Reading
1. Official Documentation & Authoritative Guides
MDN Web Docs – JavaScript Debugging & Error Handling
Mozilla's official resource. Covers the fundamentals of debugging in the browser, usingconsole.log()vs.console.error(),try...catchstatements, and an introduction to breakpoints.
Read: "JavaScript debugging and error handling" on MDN.
Chrome DevTools Official Docs – Breakpoints Guide
Google Chrome Developers. A deep dive into every type of breakpoint available in DevTools (line-of-code, conditional, DOM, event listener, and XHR/fetch breakpoints), along with step-by-step setup instructions.
Read: "Pause your code with breakpoints" on Chrome DevTools.
2. Comprehensive Debugging Guides (2025–2026)
Zencoder – JavaScript Debugging Guide
A complete walkthrough covering the Elements, Sources, Network, and Performance panels. Includes practical case studies for fixing real-world bugs.
DebugBear – How To Debug JavaScript In Chrome DevTools
An in-depth tutorial focusing on advanced Source panel features, setting watches, stepping through code, and inspecting scope chains.
AppSignal – Beyond
console.log
Discusses modern strategies such as structured logging, global error capturing (window.onerror), breadcrumb trails for user actions, and real-time monitoring in production.
Medium – How to Debug JavaScript Like a Pro in 2025
A practical list of 10 actionable tips, including smartconsole.logusage,console.table(), thedebuggerstatement, Node.js debugging, VS Code integrated debugger, and handling asynchronous code.
3. Advanced Debugging Mindset & Best Practices
BaseScripts – Debugging JavaScript Like a Senior Engineer
Focuses on the why behind bugs rather than just the what. Covers:
Debugging causes, not symptoms – tracing the event chain that leads to a state.
The three types of bugs – State bugs, Time bugs, and Assumption bugs.
Async debugging – tracking execution across microtasks and macrotasks.
Closure and stale state debugging.
Production debugging strategies (logging, error tracking services).
DEV Community – Stop Using
console.log
Argues for reducing reliance onconsole.login favor of breakpoints, conditional breakpoints, and logpoints (which print messages without stopping execution).
Tsecurity – Breakpoint Debugger vs.
console.log
A comparative analysis that helps developers choose the right tool for the right scenario, highlighting when quick logs are acceptable and when breakpoints are indispensable.